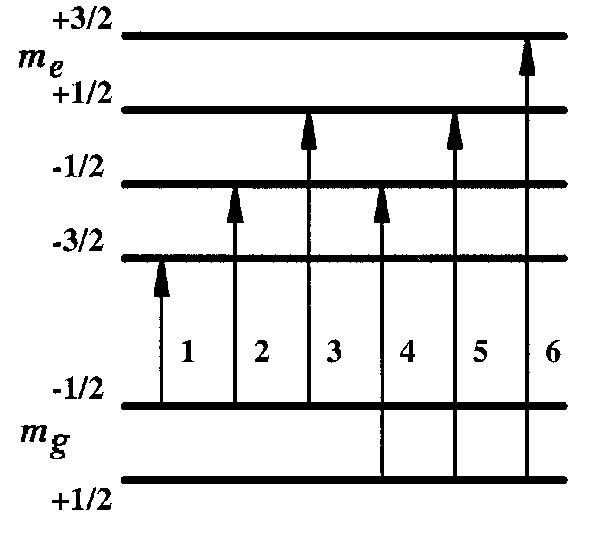
Energy level diagram for 57Fe in a static magnetic field. | By tuning a source to drive a specific transition in the sample, one selected hyperfine level can be populated. When the excited nucleus returns to its ground state, it will emit radiation that can be Mössbauer analysed. |
Top: Transmission spectrum of Fe metal showing the six absorption limes that correspond to the six transitions identified in the level diagram above. Bottom: SEDM spectra obtained while driving lines 1 - 3 (red arrows). |
If the magnetic environment is static (as here in alpha-Fe), then the radiation re-emitted is just that allowed by the selection rules for the populated state. Thus driving line 1 (red arrow) simply yields line 1, while driving lines 2 or 3 yields two lines as there are two allowed transitions from the me = +1/2 and -1/2 states. |
Top: Transmission Mössbauer spectrum for amorphous-Fe80B20 at room temperature. Bottom: SEDM spectra obtained on the same sample while driving lines 1 and 2 (red arrows). |
Chemical disorder leads to substantial line broadening in the transmission spectrum, and this static disorder also leads to increased linewidth in the SEDM spectra. The SEDM patterns can be fitted by assuming that the line broadening is just due to the static disorder seen by transmission. |
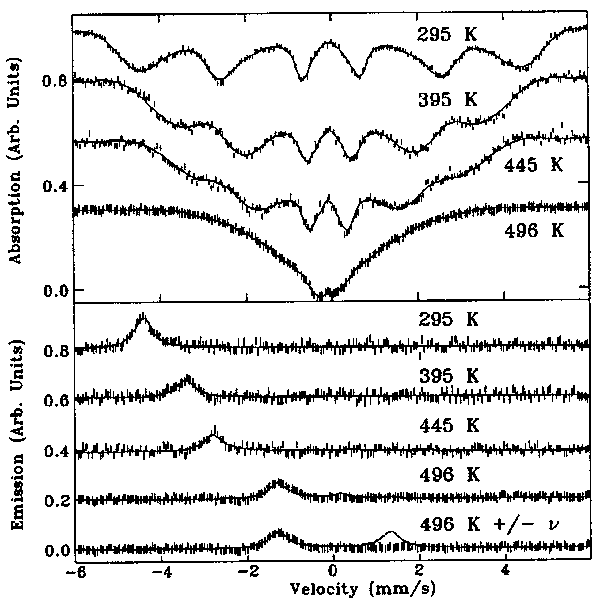
Top: Transmission spectra of INVAR at various temperatures. Bottom: SEDM spectra obtained while driving line 1 at the same temperatures. The lowest SEDM pattern shows a fit calculated assuming that the form of the transmission spectrum at 496 K is due to relaxation effects. |
The transmission spectra of Fe65Ni35 ``INVAR''
can be fitted equally well by assuming either static or dynamic
effects are dominant. However the SEDM spectra shown here can be fitted by assuming only static broadening is present. Dynamic effects would lead to an additional line (as shown for the 496 K spectrum) and this feature allows us to rule out any dynamic contribution faster than 0 ± 0.1 MHz. The order is purely static. |
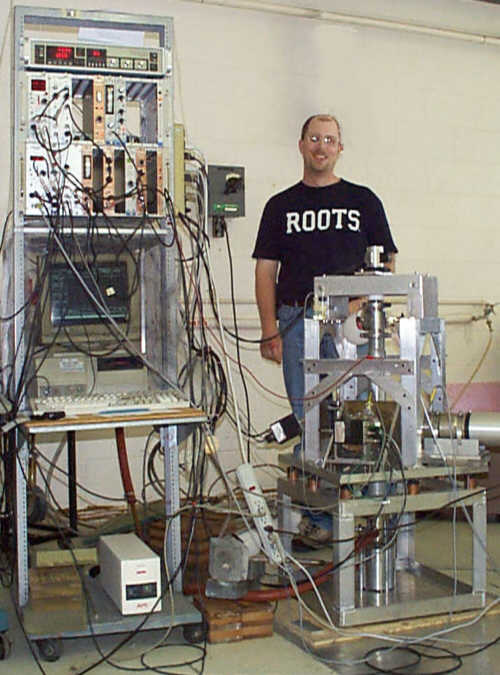
The electronics stack, at the left, is a conventional Mössbauer setup,
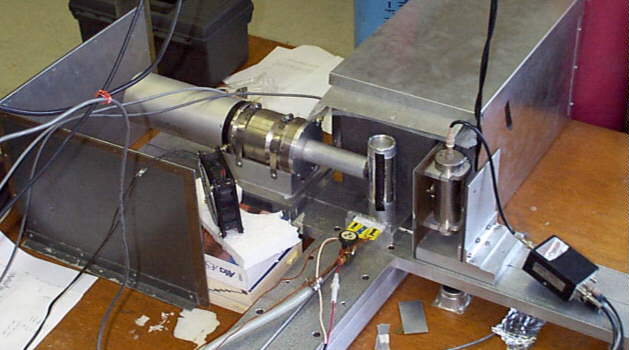
and the sample is cooled by the closed-cycle fridge at the lower right. The spectrometer is completely vibration-isolated to prevent external line broadening effects from destroying the resolution. The system was designed and built by Johan van Lierop who is standing behind the system trying to not look surprised that it all works. |
SEDM spectra of a 6 nm ferrofluid obtained by driving line 1. With increasing temperature, first the direct line at -7mm/s broadens as collective excitations develop, then a new line (6) appears at +7 mm/s as moment reversals start. |
By 70 K superparamagnetic spin-flips have started and a new line develops at +7 mm/s. This line can only be due to moment reversals and is clear evidence of magnetic dynamics. It was the absence of this feature from the INVAR data that allowed us to rule out dynamic effects in that system. |
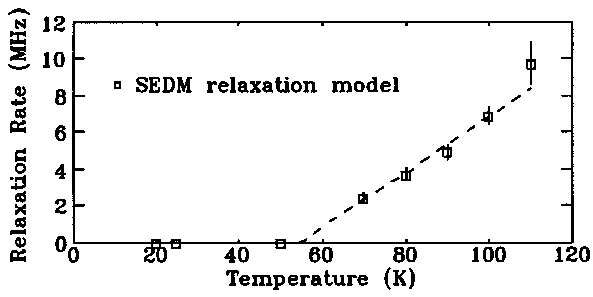
Relaxation rates derived from the SEDM spectra shown above. Moment reversals occur above the blocking temperature of 54 ± 3 K. |
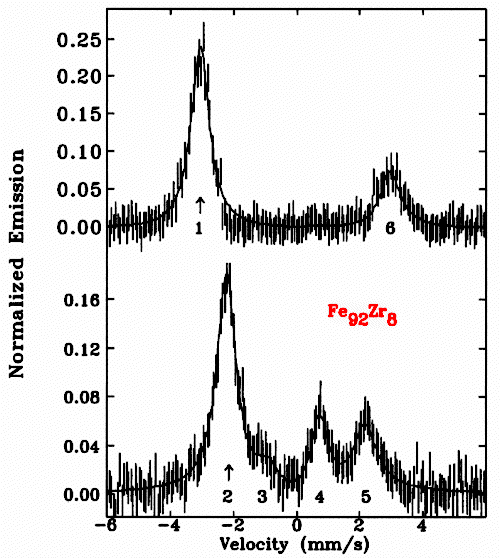
SEDM spectra a-Fe92Zr8 at 80K obtained driving line 1 (top) and line 2 (bottom). The additional lines due to moment reversals associated with the fluctuations at Txy are clearly evident. |
As with the ferrofluids shown above, moment reversals lead to additional lines in the SEDM spectrum. Line 6 appears when line 1 is driven, while a more complex 4-line pattern is observed when line 2 is driven. Even without further analysis, the spectra clearly demonstrate that relaxation is taking place. |
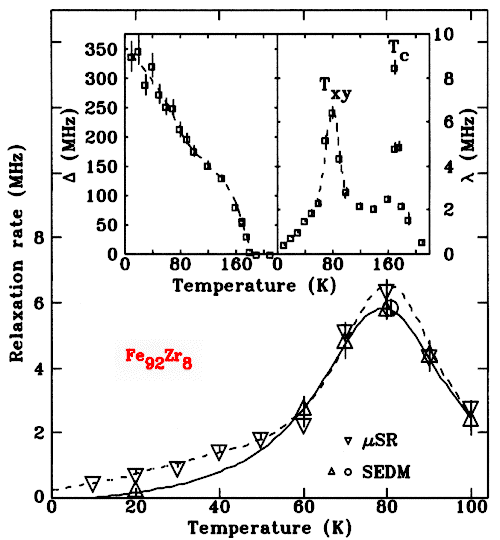
Comparison of relaxation rates derived from µSR and SEDM around Txy for a-Fe92Zr8. Insets show the static (left) and dynamic (right) signals derived from µSR for both Tc and Txy. |
The comparison with µSR is particularly instructive. µSR is an interstitial probe that is affected by any fluctuations in its magnetic environment. By contrast, SEDM probes the behaviour of the iron moments directly, and is dominated by moment reversals. The almost perfect agreement in derived relaxation rates around Txy indicates that moment reversals are the dominant relaxation mechanism. |